Processing, Interpretation and Applications
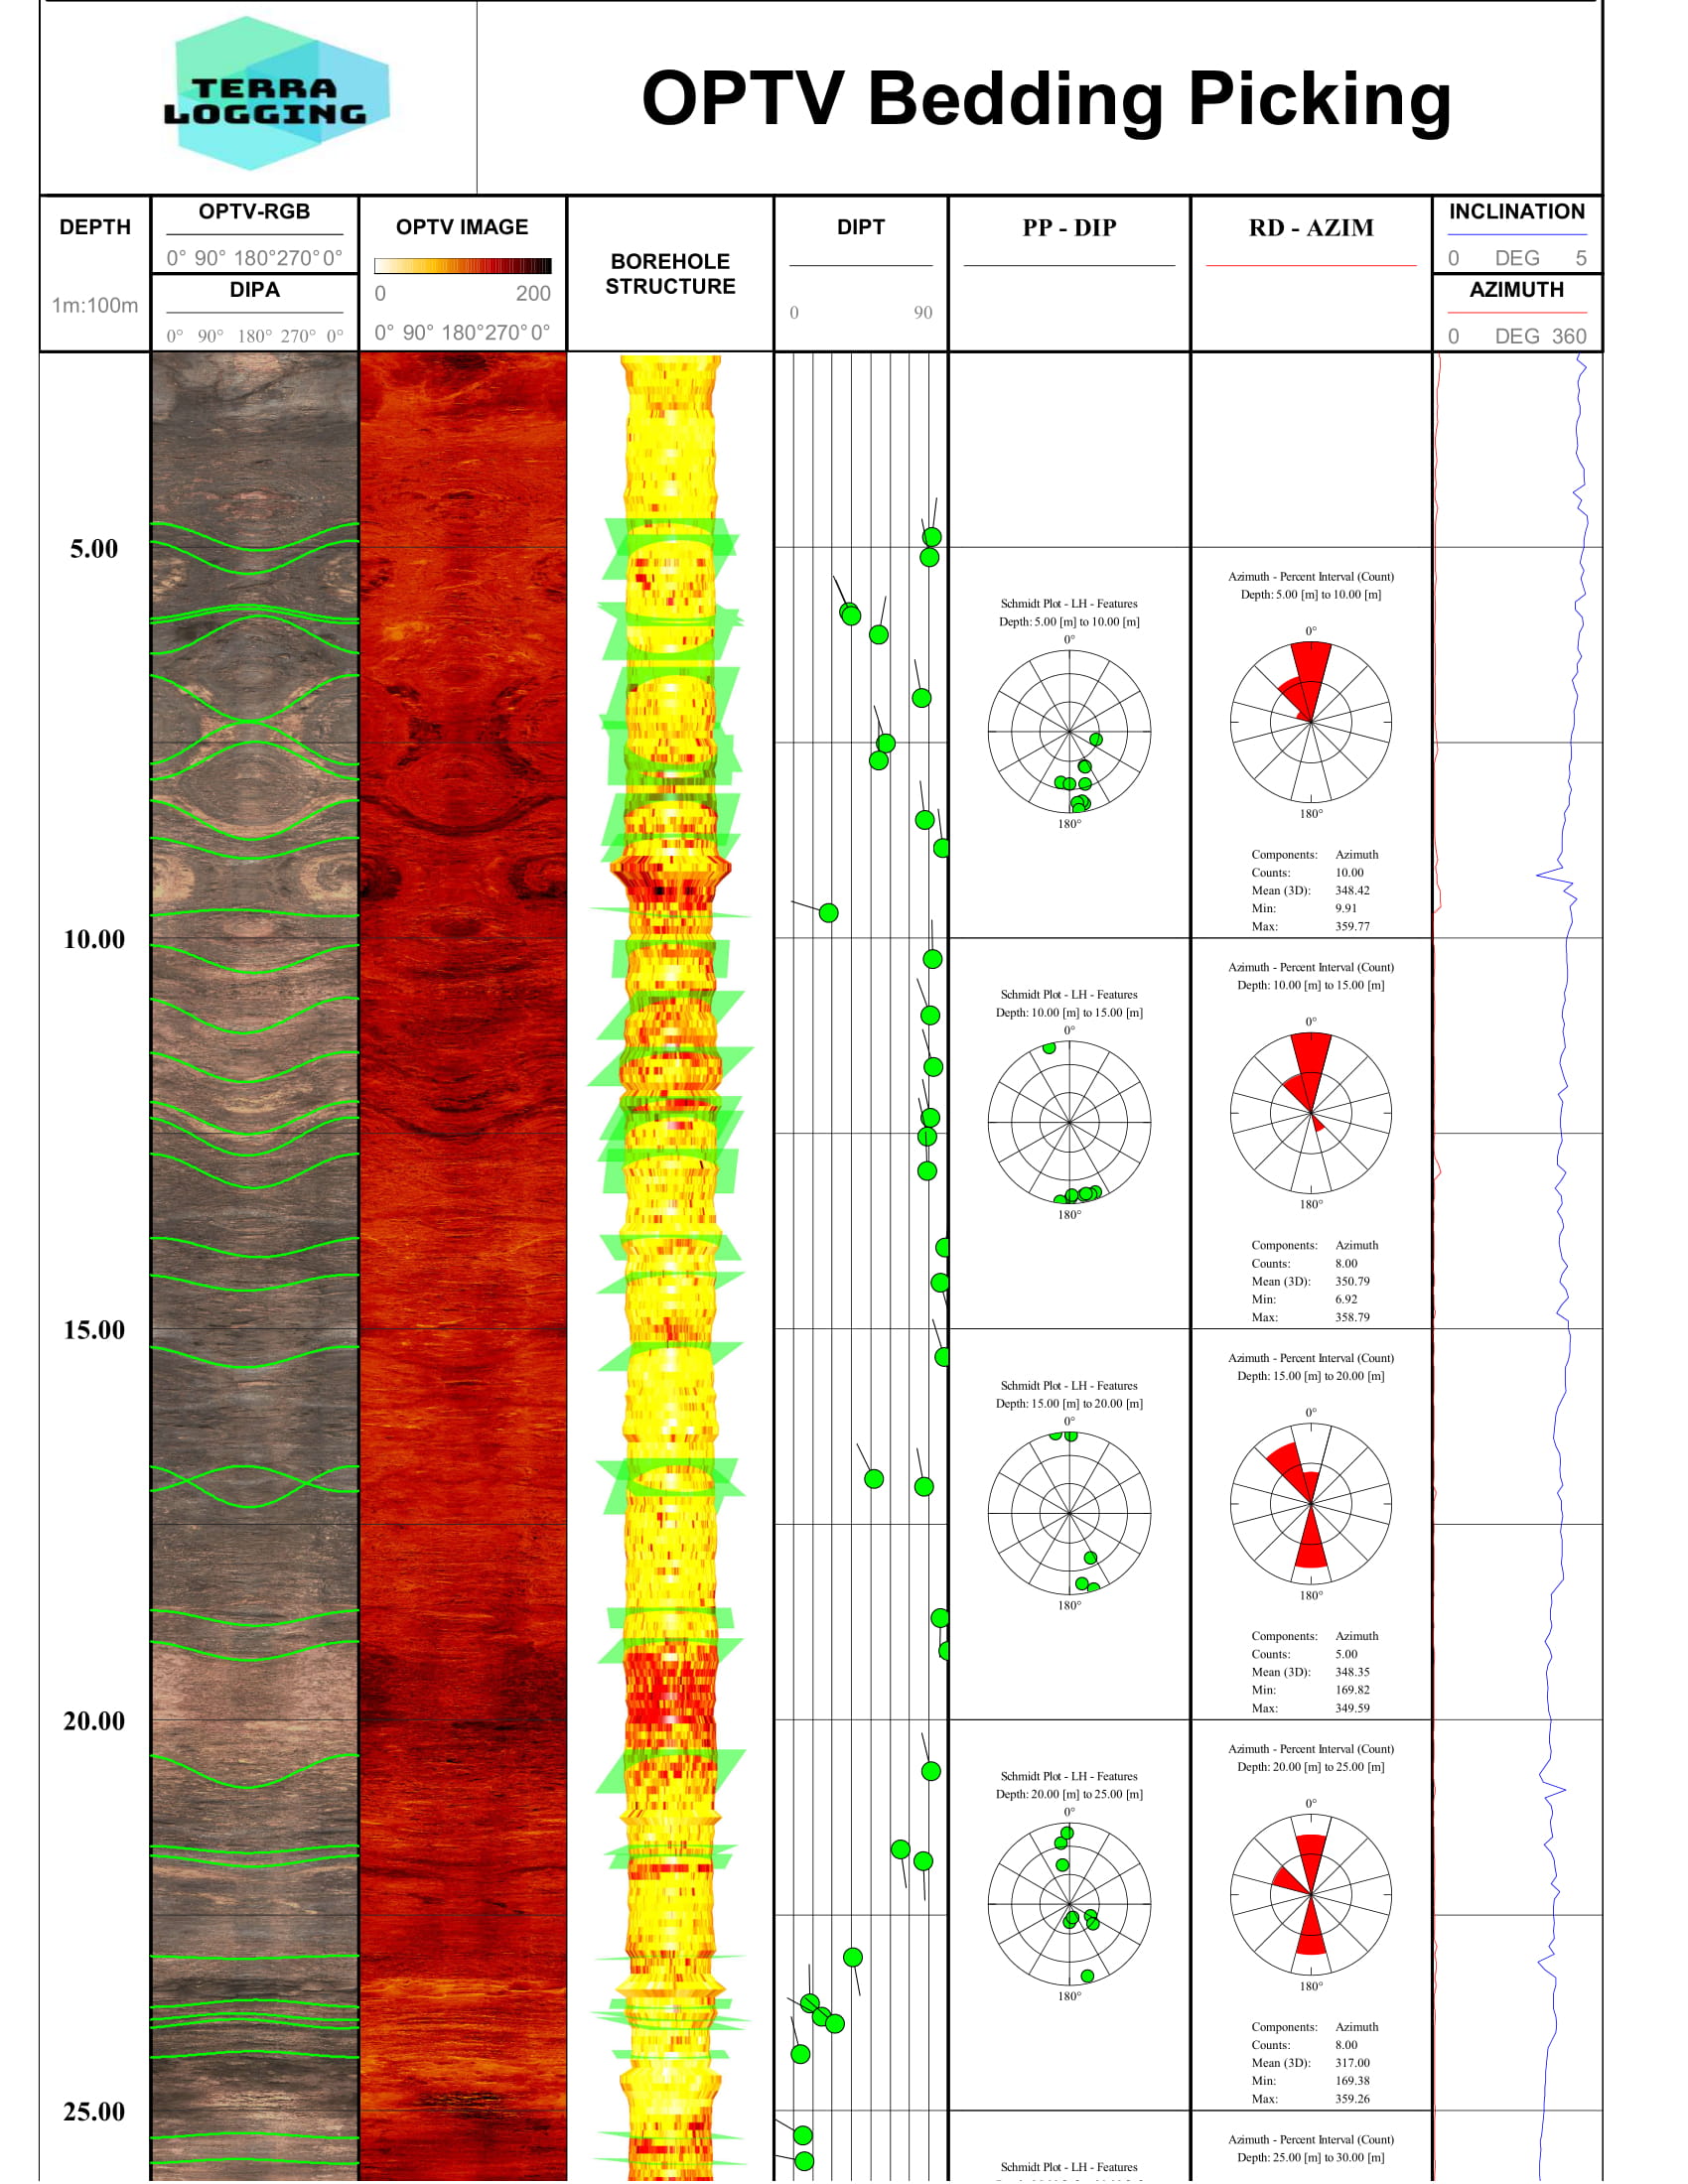
Optical televiewer generates an oriented 360 degree image of the borehole wall by way of a CCD camera recording the imaged reflected from a prism.
Acoustic and optical televiewers provide a record of the location, character, and orientation of any features in the casing or borehole wall that alter the reflectivity of the acoustic signal.
These include diameter and shape of the borehole, rugosity of the borehole wall that may be caused by drilling procedures or lithology, differences in rock hardness and structural features such as bedding, fractures and solution openings.
In addition to providing a photograph like image that can be interpreted in terms of the character of these features, televiewer logs also permit calculation of orientation of fractures and bedding planes. The smallest feature that can be resolved on an televiewer log depends on a number of factors, such as borehole diameter and borehole-wall roughness.
Acoustic imaging devices are very powerful and they provide: amplitude and travel time.
The amplitude represents the strength of the acoustic signal return from the borehole wall. In the example above, the darker areas (brown) represent a low amplitude signal and the lighter areas (yellow) represent a higher amplitude signal.
The travel time represents the time it takes the acoustic signal to return from the borehole wall. Larger voids and cavities may result in signal loss. In the example above, the lighter areas (yellow) represent increased travel time and the darker areas (brown) represent a decreased travel time.
A low amplitude signal (darker) and no travel time impedance detected would indicate that the feature has a lower acoustic signature (softer material) and it may be an indication of bedding or a closed fracture. If impedance in travel time is identified, the feature may be opened or partially opened (fracture or fault).
The rock hardness will directly affect the amplitude. The acoustic signal detected by the transducer will be directly proportional with the rock hardness. The rock hardness ATV interpretation is particularly difficult in a fractured geological environment. The acoustic signature of the fractures will interfere with rock hardness acoustic response. Thus a comprehensive knowledge of local lithology and structural geology is essential.
The acoustic amplitude may be further processed into developing additional interpretation tools.
The rock hardness indicator (RHI) is a good tool to use when starting hardness analysis. RHI will show rock hardness biased by fractures, faults and any other cavities.
Acoustic hardness analysis logs (AHA™) will define the hardness in a variable number of window signals with different strength. AHA™ in a fractured geological environment may enlighten the true rock hardness by filtering out low amplitudes. Fractures can be further filtered out with AHAF™.
Fracture Density is an additional tool that can help identify zones of anomaly low rock hardness.
Apparent Joint / Fracture Density (AJD™) – fractures per meter calculated similar on core. Borehole orientation is not considered.
True Vertical Joint / Fracture Density (TJD™) – Apparent Fracture Density is corrected for borehole inclination
Projected Joint / Fracture Density (PJD™) = Projected Normalized Dip – True Fracture Density is extended one meter normal to the dip direction.
True Dip Joint / Fracture Density (DJD™) = Normalised Dip – True Fracture Density is calculated normal to dip projected only within 1 meters length borehole boundaries.
Rock Quality Designation (RQD) has been used for over 50 years as an index of rock quality. It measures the percentage of “good” rock within a borehole. RQD is measured as a percentage of the drill core in lengths of 10 cm or more. High-quality rock has an RQD of more than 75%, low quality of less than 50%. RQD closer to 100 % may indicate true rock hardness values.
Basic Televiewer Interpretation Iron Ore environment